Spectrum Pane
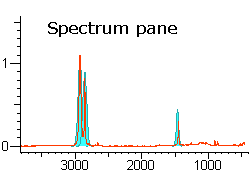
A spectrum from a file loads into the Spectrum pane, with wavenumbers (cm-1) and relative intensities labeling the x- and y-axes, respectively.

Right click anywhere in the Spectrum pane to display the Spectrum Pane pop-up menu.
A spectrum from a file loads into the Spectrum pane, with wavenumbers (cm-1) and relative intensities labeling the x- and y-axes, respectively.

Right click anywhere in the Spectrum pane to display the Spectrum Pane pop-up menu.