Bar Chart Pane
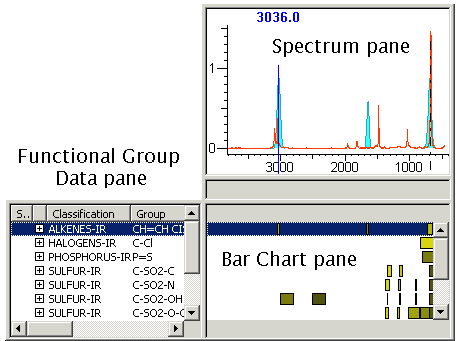
The Bar Chart pane at the lower right-hand corner of the AnalyzeIt IR, AnalyzeIt Raman, and AnalyzeIt Polymer IR application's main window visually links the information in the Functional Group Data pane with the loaded spectrum. It does this by using colored bars to represent the peaks associated with each functional group class. The bars are intensity coded; lighter color means greater intensity.
For the selected functional group, the expected spectral bands are reflected in a colored overlay on the Spectrum pane. In this example, turquoise alkene peaks are superimposed on the red spectrum.

Right click anywhere in the Bar Chart pane to display the Summary pop-up menu.